Unlocking the power of data to guide business decisions and discover new opportunities relies on using smart data analysis techniques. Just like a detective unravels a complex case, big data analytics enables organizations to dig deep into vast and varied datasets. By uncovering valuable insights from this sea of information, organizations can make wiser and more informed business choices.
This data-driven approach isn’t just a trend; it’s becoming a game-changer in various industries, including banking, manufacturing, telecom, insurance, transportation, government, utilities, and more. These industries are increasingly relying on data analysis techniques to understand patterns, predict trends, and ultimately make decisions that drive success. And this is where business process outsourcing services come into play, helping organizations boost the efficiency and effectiveness of the entire analytics process. Having a reliable partner that helps companies make sense of their business intelligence ensures that every piece of information contributes to smarter and more strategic moves.
How to Transform Raw Data into Actionable Insights
Before diving into analysis techniques, it’s essential to understand how raw data is taken and transformed into relevant, actionable insights. Businesses gather information from various sources such as customer records, social media metrics, internal reports, and sales systems. However, this information comes in unstructured and distinct formats, requiring significant refinement before it can be utilized. The process of converting raw information into usable records involves the following steps:
- The first step is collecting and organizing the information in a structured manner. This involves cleaning, formatting, validating and standardizing processes to remove errors, anomalies, and inconsistencies from unprocessed inputs.
- Data integration follows, where information from different sources is combined to create a unified dataset and stored in repositories such as data lakehouse. This step includes processes such as preparation, replication, and verification to ensure accuracy and consistency.
- Next, the refined dataset undergoes transformation to fit the analysis goals, such as converting formats or calculating new variables. Analysts then examine and interpret this processed information to detect patterns, trends, and anomalies that might indicate business opportunities or risks.
- The findings of the analysis are presented in the preferred formats, including written reports, dashboard, and maps. Data visualization tools are often used to simplify information in charts or graphs as they reveal insights more clearly than numbers.
- Finally, these findings are translated into practical recommendations or evidence-based decisions that align with business objectives.
Understanding this journey clarifies why analysis techniques are necessary and how they fit into the larger framework of turning raw insights into value. There are different types of techniques for extracting useful information from raw inputs. Depending on the type of data in question and the insights required, analysts need to use effective data analysis techniques to harness the full potential of the information.
Best Data Analysis Techniques for Informed Business Decisions
The two basic methods for analyzing data are categorized as qualitative and quantitative.
Quantitative analysis involves the use of numerical data and statistical methods to draw conclusions and make inferences. This method focuses on objective measurements, quantifiable variables, and statistical models. For instance, consider an email marketing campaign aimed at increasing product sales. Collecting and analyzing metrics such as number of emails sent, emails opened, click-through-rate (CTR) and purchases can provide insights into the performance of the campaign. This will allow marketers to assess engagement levels and the overall success in driving product sales.
Qualitative analysis involves the examination of non-numerical data to identify patterns, themes, and insights. It can provide rich insights into customers’ experiences and perceptions. For example, suppose a company has introduced a new mobile app, qualitative analysis can provide rich insights into customers’ perceptions and experiences with the product.
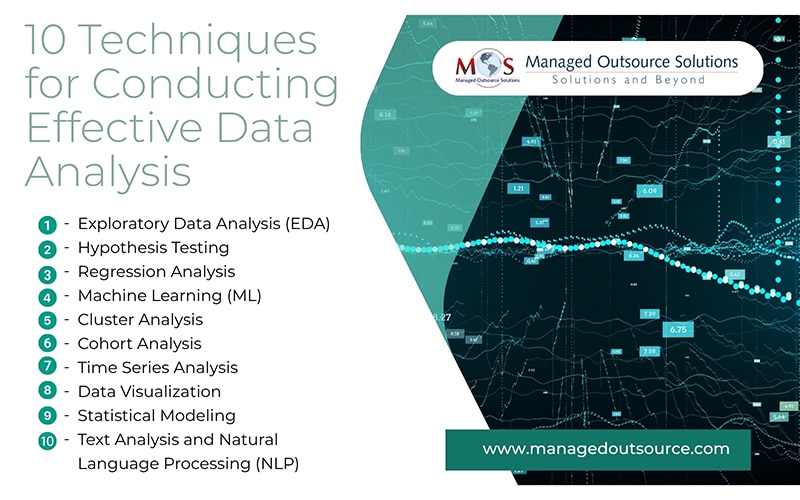
Effective analysis involves using a combination of techniques to extract meaningful insights from raw inputs. Here are 10 effective data analysis techniques:
- Exploratory Data Analysis (EDA): The EDA technique is used to understand and visualize datasets. It aims to discover patterns, relationships, and insights within the dataset before undertaking in-depth analysis. This method involves summarizing the main characteristics of the dataset, such as central tendencies, distributions, and correlations, and identifying any missing or outlier values. EDA uses a combination of statistical techniques, visualizations, and data manipulation methods to visually and statistically explore the dataset.
- Hypothesis Testing: Hypothesis testing in analytics is used to determine if observed patterns or differences in the data are statistically significant. Common tests include t-tests, chi-square tests, and ANOVA.
- Regression Analysis: This is a process of testing whether an assumption or hypothesis about a population parameter is supported by the available information. Regression analysis is conducted to model the relationship between variables. Linear and logistic regressions are used to understand how one variable influences another.
- Machine Learning (ML): ML automates the process of extracting insights from large and complex datasets, making it a powerful tool for data analytics. ML algorithms are employed for predictive modeling and classification tasks. Techniques such as decision trees, random forests, support vector machines, and neural networks can uncover complex patterns.
- Cluster Analysis: This analytic technique aims to group similar objects or data points together into clusters. The goal of cluster analysis is to discover patterns or structures in the dataset without any prior knowledge or labels. It is widely used in customer segmentation, market research, image analysis, social network analysis, and anomaly detection.
- Cohort Analysis: Cohort analysis, a branch of behavioral analytics, involves dissecting information from a specific dataset. Instead of treating all users as a singular entity, it segregates them into related groups, termed cohorts, based on shared characteristics or experiences within a defined time period. For instance, by scrutinizing customers’ actions within the customer life cycle can help identify behavioral patterns at different stages of the customer journey. This analysis can span from their initial visit to your website, progressing through email newsletter sign-up to their initial purchase, and beyond.
- Time Series Analysis: This is a statistical method used to analyze and understand patterns, trends, and relationships within a sequence of data points over time. Time series analysis in business is used to model data such as stock prices, weather data, sales figures, or sensor measurements and make forecasts based on historical patterns and trends.
- Data Visualization: Creating effective data visualizations such as charts, graphs, and dashboards can communicate insights clearly. This can help present complex information in a visually appealing and understandable way.
- Statistical Modeling: Advanced statistical models are used to understand complex relationships within the dataset. Techniques such as multivariate analysis of variance (MANOVA) or structural equation modeling (SEM) may be relevant in certain contexts.
- Text Analysis and Natural Language Processing (NLP): Text analysis and NLP techniques are employed to extract insights from unstructured text inputs. This includes sentiment analysis, topic modeling, and named entity recognition.
Combining these techniques in a systematic manner can generate more robust and actionable insights from your information. It is crucial to customize the approach according to the unique features of the data and the objectives of the analysis.
How Data Analytics Makes the Difference
Data analytics aims to unveil secret patterns, unexpected connections, market trends, and what customers really want. These revelations give organizations the ability to spot new challenges, risks, and golden opportunities, guiding them towards making savvy and well-thought-out business choices. Analyzing big data makes day-to-day operations smoother, supports strategic decision-making, and ultimately helps businesses stay ahead of the game.
- Identifies Patterns and Trends
By analyzing extensive datasets, analytics uncovers patterns, trends, and correlations not visible through traditional methods. These insights support informed decision-making. For instance, an e-commerce company, using traditional methods like small transaction samples or feedback forms, may gain limited insights. However, analyzing a comprehensive dataset, including purchase history and preferences, reveals intricate patterns. For example, analytics may reveal that customers who buy item A are likely to purchase item B within a specific timeframe or show a connection between the time of day and customer product preferences.
- Enables Customer Understanding and Personalization
Identifying customer segments based on preferences, purchase history, and demographics, data analysis leads to more targeted and effective marketing strategies. Amazon is a classic example of a company that leverages customer segmentation analysis to optimize its operations and provide a seamless, personalized shopping experience for millions of customers across the world. Amazon employs analytics to understand customer information, including browsing patterns, purchase records, and product ratings, to offer tailored product suggestions. Marketing strategies are tailored for each segment. For example, customers who frequently purchase a specific product category may receive promotions related to those items, and so on. This strategy enables the e-commerce giant to present customers with items that align closely with their interests, significantly enhancing the likelihood of successful purchases.
- Supports Targeted Advertising
Netflix is a great example of effective big data analytics employed for making personalized recommendations for targeted advertising. With a massive subscriber base exceeding 300 million, the company leverages extensive data collection, a cornerstone in solidifying Netflix’s industry standing. For subscribers, the personalized experience is evident in the tailored movie suggestions provided. This customization is driven by the analysis of past search and viewing records, offering insights into each subscriber’s preferences.
- Drives Digital Transformation
Analytics play a central role in driving digital transformation, enhancing decision-making in dynamic business landscapes. Take the healthcare industry: replacing paper-based patient records with digitized information and analytics leads to a transformative shift. Patient information is centralized, facilitating real-time analysis for quicker and more precise decision-making. The integration of predictive analytics techniques also allows early detection of health trends, revealing the power of data-driven strategies in evolving sectors like healthcare.
- Boosts Operational Efficiency
Using analytics optimizes processes and resource allocation. For instance, in the manufacturing process, implementing analytics makes it more responsive to real-time demands and reduces inefficiencies. By analyzing equipment performance metrics, for example, manufacturers can predict potential breakdowns and schedule maintenance properly to reduce downtime.
- Risk Mitigation
By analyzing historical information and predicting potential future challenges, businesses can discover and manage risks. Utilizing predictive analytics enables them to forecast future trends and outcomes, driving proactive decision-making. Financial institutions like banks utilize advanced analytics techniques to evaluate a customer’s credit history, financial behavior, and other relevant information to assess their creditworthiness more accurately. Improved credit risk assessment leads to more accurate lending decisions, reducing the likelihood of defaults.
- Fraud Detection
Analytics is helpful in detecting anomalies and patterns indicative of fraudulent activities, enhancing security measures. For instance, banks employ analytics algorithms to analyze transactions in real-time, identifying unusual patterns or deviations from a customer’s typical behavior, triggering immediate alerts for potential fraud. This allows them to make informed decisions to prevent fraud.
- Strategic Planning
Businesses can formulate and refine their strategic plans based on insights gained from data analytics, adapting to market dynamics and changing conditions.
Data and analytics have progressively emerged as pivotal catalysts for business success. The potential for data-driven business strategies is now more significant than ever, further fueling the momentum of digital transformation and data-centric business approaches. Gartner has formulated over 100 strategic planning assumptions for data and analytics, spanning the years up to 2028. These assumptions are categorized into four groups, addressing the future of the following strategic areas: core data and analytics, IT leadership, data and analytics in digital business functions, and data and analytics in industry verticals. Recent research from Gartner highlights that 70% of Chief Data and Analytics Officers (CDAOs) are primarily responsible for developing their organization’s AI strategy and operating model (echnologymagazine.com.
- Performance Measurement
Analytics provides metrics and key performance indicators (KPIs) for measuring and evaluating the performance of various business aspects. For example, when it comes to web performance, analyzing metrics such as page views, bounce rate, and time on site indicate how visitors are engaging with your site. Evaluating Key Performance Indicators (KPIs) such as conversion rates, click-through rates, website loading speed allow you to measure your website’s performance.
- Employee Productivity
Analyzing employee information can lead to insights on productivity patterns, allowing organizations to optimize workforce performance. For instance, consider an IT company that wants to improve the productivity of its software development team. Analyzing employee metrics such as work hours on specific tasks, time taken to complete different projects, task assignment, and effectiveness of collaboration among team members will provide actionable insights that the company can use to optimize work processes, improve productivity, and create a more conducive work environment for its software development team.
- Cost Reduction
By identifying inefficiencies and optimizing resource utilization, analytics contributes to cost reduction and improved financial performance. Consider a company looking to optimize its supply chain operations. Implementing real-time monitoring and analytics to identify bottlenecks and inefficiencies in the supply chain, can lead to cost reductions and faster order fulfillment.
- Regulatory Compliance
Analytics plays a crucial role in bolstering regulatory compliance by offering transparency into processes and practices, thereby reducing legal risks. The U.S. Department of Justice (DOJ) underscores the significance of robust data analytics in anti-corruption compliance programs. For instance, scrutinizing financial transactions, employee expense reports, and other pertinent datasets enables the identification of irregular patterns like inflated invoices, excessive expenses, or suspicious payments. Companies can then implement real-time, automated monitoring systems to flag such activities, investigate them and take necessary remedial actions promptly to ensure regulatory compliance (www.law.com).
In a recent ECCP guidance, the DOJ reinforces that corporate compliance programs must demonstrate effectiveness using analytic tools, ensuring that the technology used is on par with other core business functions. This includes using statistical testing, screening tools, and monitoring communications to identify and respond to antitrust risks proactively. Organizations are also expected to leverage analytics to assess policy adherence, monitor issue resolution, and evaluate the overall culture of compliance.
How Data Cleaning Services Support Analytics
Data cleansing and preprocessing are foundational or initial steps in the data analytics process. By identifying and rectifying missing values, outliers, inconsistencies, and inaccuracies in the dataset, data accuracy ensures more trustworthy results.
Data cleansing is an integral component of the support offered by business process outsourcing companies. These reliable data cleansing service providers clean and preprocess data efficiently, helping businesses to obtain more meaningful and relevant insights from analytics. When stakeholders can trust the data quality, they are more likely to have confidence in the results and conclusions drawn from the analytics. This is crucial for making informed business decisions.
Leverage best-in-class BPO solutions for operational excellence!